Denver Urban Pulse
Production BI Dashboard — Live City Analytics
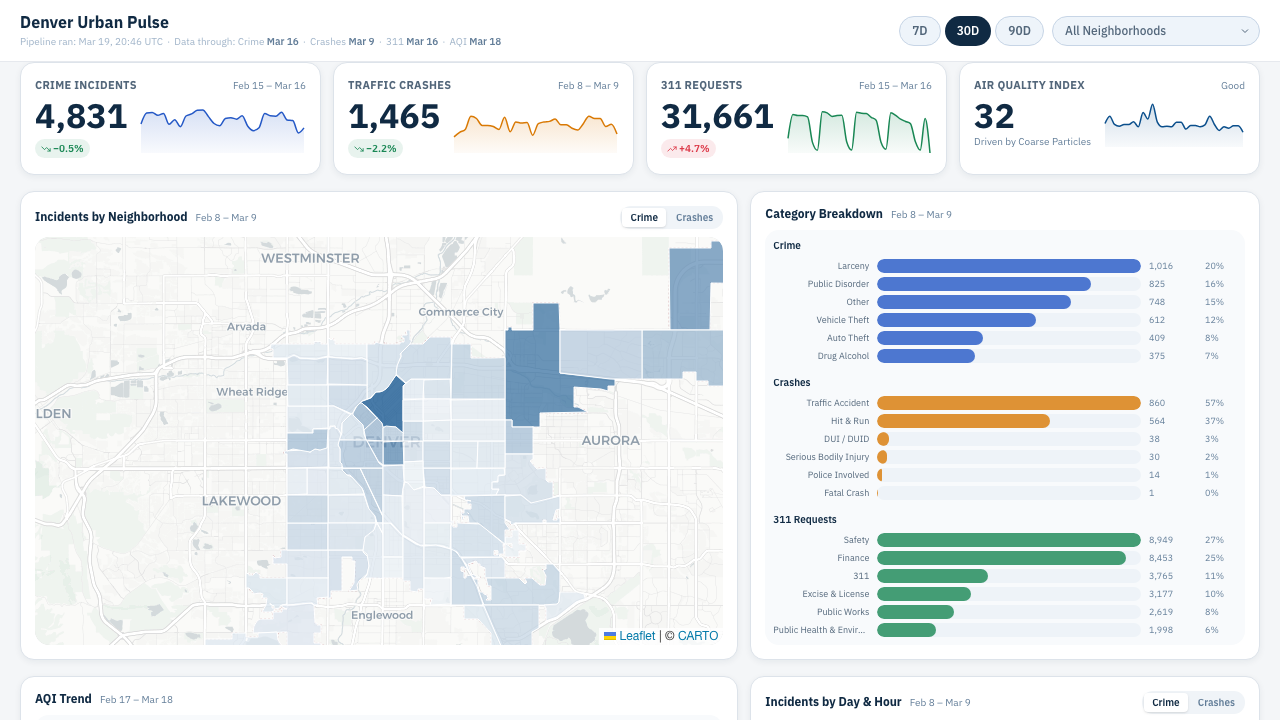
Interactive analytics dashboard with daily-refreshed data from 4 public APIs. Three-layer data pipeline (raw → staging → marts), choropleth map, heatmaps, KPI cards with sparklines, and global filtering.
Next.js TypeScript PostgreSQL Python Leaflet Recharts Railway Vercel
Overview
Denver Urban Pulse is a public BI dashboard built on live Denver open data, refreshed daily. It tracks the city’s operational pulse across crime, traffic crashes, 311 service requests, and air quality — broken down by neighborhood. The goal: give residents, journalists, and city stakeholders a clear picture of what’s happening without digging through raw government datasets.
Architecture
┌─────────────────────────────────────────────────────┐
│                    Data Sources                      │
│  ArcGIS (Crime, Crashes, 311)  ·  AirNow API (AQI)  │
└──────────────────────┬──────────────────────────────┘
                       │  daily cron (06:00 UTC)
                       ▼
┌─────────────────────────────────────────────────────┐
│              Python Pipeline (Railway)               │
│  Migrations → Ingestion → Staging → Marts            │
└──────────────────────┬──────────────────────────────┘
                       │
                       ▼
┌─────────────────────────────────────────────────────┐
│              PostgreSQL (Railway)                     │
│  raw (5 tables) → staging (5) → marts (9)            │
└──────────────────────┬──────────────────────────────┘
                       │
                       ▼
┌─────────────────────────────────────────────────────┐
│          Next.js API Routes (Vercel)                 │
│  /city-pulse/kpis  · /categories · /heatmap          │
│  /category-trends  · /neighborhoods                  │
│  /environment/aqi  · /environment/comparison          │
└──────────────────────┬──────────────────────────────┘
                       │
                       ▼
┌─────────────────────────────────────────────────────┐
│            React Dashboard (Vercel)                   │
│  KPIs · Map · Charts · Heatmap · Ranking · Filters   │
└─────────────────────────────────────────────────────┘
Key Features
- KPI cards with sparklines, deltas, and per-domain data freshness
- Interactive choropleth map — click a neighborhood to filter the entire dashboard
- Category breakdown — incident types grouped by domain with trend sparklines
- Day & hour heatmap — incident density matrix (day-of-week × hour)
- AQI trend chart — multi-pollutant line chart (Ozone, PM2.5, PM10)
- Neighborhood ranking — composite score with domain toggle
- Change leaders — top 5 improved / worsened neighborhoods by period
- Global filters — time window (7d / 30d / 90d) and neighborhood selector
- Responsive layout — mobile, tablet, and desktop breakpoints
Data Sources
| Source | Provider | Refresh |
|---|
| Crime incidents | Denver Open Data (ArcGIS) | Daily, last 90 days |
| Traffic crashes | Denver Open Data (ArcGIS) | Daily, last 90 days |
| 311 service requests | Denver Open Data (ArcGIS) | Daily, last 90 days |
| Air quality (AQI) | AirNow API | Daily, last 90 days |
| Neighborhood boundaries | Denver Open Data (GeoJSON) | On change |
Tech Stack
| Layer | Technology |
|---|
| Frontend | Next.js 16 (App Router), React 19, TypeScript 5.9 |
| Styling | Tailwind CSS 4, shadcn/ui, IBM Plex Sans |
| Charts | Recharts 3 |
| Map | Leaflet + React Leaflet |
| Database | PostgreSQL (Railway) |
| API | Next.js Route Handlers (7 endpoints) |
| Data Pipeline | Python 3.12 daily cron (Railway) |
| Deploy | Vercel (frontend), Railway (DB + pipeline) |
| Testing | Jest 30, React Testing Library |